Hopefully this is my last post on the subject (but I suspect not, as I expect a public response from the three TRADOC authors). This is in response to the article in the December 2018 issue of the Phalanxby Alt, Morey and Larimer (see Part 1, Part 2, Part 3, Part 4, Part 5, Part 6). The issue here is the “Base of Sand” problem, which is what the original blog post that “inspired” their article was about:
While the first paragraph of their article addressed this blog post and they reference Paul Davis’ 1992 Base of Sand paper in their footnotes (but not John Stockfish’s paper, which is an equally valid criticism), they then do not discuss the “Base of Sand” problem further. They do not actually state whether this is a problem or not a problem. I gather by this notable omission that in fact they do understand that it is a problem, but being employees of TRADOC they are limited as to what they can publicly say. I am not.
I do address the “Base of Sand” problem in my book War by Numbers, Chapter 18. It has also been addressed in a few other posts on this blog. We are critics because we do not see significant improvement in the industry. In some cases, we are seeing regression.
In the end, I think the best solution for the DOD modeling and simulation community is not to “circle the wagons” and defend what they are currently doing, but instead acknowledge the limitations and problems they have and undertake a corrective action program. This corrective action program would involve: 1) Properly addressing how to measure and quantify certain aspects of combat (for example: Breakpoints) and 2) Validating these aspects and the combat models these aspects are part of by using real-world combat data. This would be an iterative process, as you develop and then test the model, then further develop it, and then test it again. This moves us forward. It is a more valued approach than just “circling the wagons.” As these models and simulations are being used to analyze processes that may or may not make us fight better, and may or may not save American service members lives, then I think it is important enough to do right. That is what we need to be focused on, not squabbling over a blog post (or seven).
On the first page (page 28) in the third column they make the statement that:
Models of complex systems, especially those that incorporate human behavior, such as that demonstrated in combat, do not often lend themselves to empirical validation of output measures, such as attrition.
Really? Why can’t you? If fact, isn’t that exactly the model you should be validating?
More to the point, people have validated attrition models. Let me list a few cases (this list is not exhaustive):
1. Done by Center for Army Analysis (CAA) for the CEM (Concepts Evaluation Model) using Ardennes Campaign Simulation Study (ARCAS) data. Take a look at this study done for Stochastic CEM (STOCEM): https://apps.dtic.mil/dtic/tr/fulltext/u2/a489349.pdf
2. Done in 2005 by The Dupuy Institute for six different casualty estimation methodologies as part of Casualty Estimation Methodologies Studies. This was work done for the Army Medical Department and funded by DUSA (OR). It is listed here as report CE-1: http://www.dupuyinstitute.org/tdipub3.htm
3. Done in 2006 by The Dupuy Institute for the TNDM (Tactical Numerical Deterministic Model) using Corps and Division-level data. This effort was funded by Boeing, not the U.S. government. This is discussed in depth in Chapter 19 of my book War by Numbers (pages 299-324) where we show 20 charts from such an effort. Let me show you one from page 315:
So, this is something that multiple people have done on multiple occasions. It is not so difficult that The Dupuy Institute was not able to do it. TRADOC is an organization with around 38,000 military and civilian employees, plus who knows how many contractors. I think this is something they could also do if they had the desire.
There is an 37-year old organization called the New York Military Affair Symposium that regular hosts speakers. Their website and speaker schedule is here: http://www.nymas.org/
This Friday (Jan 18), Max Boot will be presenting about his book The Road Not Taken: Edward Lansdale and the American Tragedy in Vietnam.
I will be presenting on 26 April based upon my book War by Numbers: Understanding Conventional Combat.
The presentations are at the Soldier Sailors Club, 283 Lexington Avenue, New York City at 7 PM.
Now, I don’t know what percent of German or Soviet tanks at Kursk were killed by other tanks, as opposed to antitank guns, mines, air attacks, infantry attacks, broken down, etc. The only real data we have on this is a report from the Soviet First Tank Army which states that 73% of their tanks were lost to AP shot.
Do not know what percent of the AP shots was fired from tanks vice towed AT guns. I would be tempted to guess half. So maybe 36% of the Soviet tanks destroyed was done by other tanks? This is a very rough guess. Suspect it may have been a lower percent with the Germans.
Still, it is natural to want to compare tank losses with tank losses. The Germans during the southern offensive at Kursk had 226 tanks destroyed and 1,310 damaged. This includes their self-propelled AT guns (their Marders).
The Soviet units during the southern offensive at Kursk had 1,379 tanks destroyed and 1,092 damaged. This includes their self-propelled AT guns, the SU-152s, SU-122s and the more common SU-76s. If I count SU-76s in the Soviet tank losses, then I probably should count the Marders in the German losses.
So….comparing total losses to total losses results in 1,536 German tanks damaged or destroyed versus 2,471 Soviet tanks damaged or destroyed. This is a 1-to-1.61 exchange ratio.
On the other hand, some people like to only compare total destroyed. This comes out to a rather lop-sided 1-to-6.10 exchange ratio.
A lot of sources out there compare only lost tanks to lost tanks. This provides, in my opinion, a very distorted figure of combat effectiveness or what is actually occurring out on the battlefield.
Added to this some sources have been known to remove German command tanks from their counts of strengths and losses, even though at this stage the majority of command tanks were armed. The Germans sometime don’t list them in their own daily reports. Of course, Soviet command tanks are always counted (which are armed). Some have been know to remove German Panzer IIs and other lighter tanks from their counts, even though at Kursk on 4 July, 23% of Soviet tanks were the lighter T-60s, T-70s and M-3 Stuarts (see page 1350 of my book). Many counts remove the German self-propelled AT guns from their counts, but not sure if they have also removed the Soviet SU-152, SU-122s and SU-76s from their counts. Finally, a number of counts remove German assault guns from their comparisons, even though at Kursk they were often used the same as their tank battalions and sometimes working with their tank battalions. They were also better armed and armored than some of their medium tanks. In the later part of 1943 and after, some German tank battalions were manned with assault guns, showing that the German army sometimes used them interchangeably. So there are a lot of counts out there on Kursk, but many of them concern me as they do not give the complete picture.
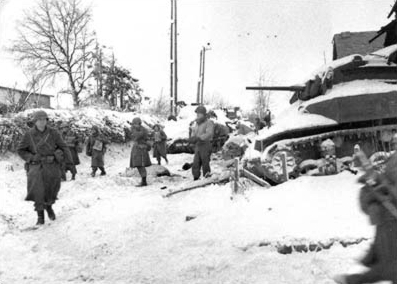
American soldiers of the 117th Infantry Regiment, Tennessee National Guard, part of the 30th Infantry Division, move past a destroyed American M5A1 “Stuart” tank on their march to recapture the town of St. Vith during the Battle of the Bulge, January 1945. [Wikipedia][This piece was originally posted on 16 May 2017.]
This post is a partial response to questions from one of our readers (Stilzkin). On the subject of force ratios in conventional combat….I know of no detailed discussion on the phenomenon published to date. It was clearly addressed by Clausewitz. For example:
At Leuthen Frederick the Great, with about 30,000 men, defeated 80,000 Austrians; at Rossbach he defeated 50,000 allies with 25,000 men. These however are the only examples of victories over an opponent two or even nearly three times as strong. Charles XII at the battle of Narva is not in the same category. The Russian at that time could hardly be considered as Europeans; moreover, we know too little about the main features of that battle. Bonaparte commanded 120,000 men at Dresden against 220,000—not quite half. At Kolin, Frederick the Great’s 30,000 men could not defeat 50,000 Austrians; similarly, victory eluded Bonaparte at the desperate battle of Leipzig, though with his 160,000 men against 280,000, his opponent was far from being twice as strong.
These examples may show that in modern Europe even the most talented general will find it very difficult to defeat an opponent twice his strength. When we observe that the skill of the greatest commanders may be counterbalanced by a two-to-one ratio in the fighting forces, we cannot doubt that superiority in numbers (it does not have to more than double) will suffice to assure victory, however adverse the other circumstances.
and:
If we thus strip the engagement of all the variables arising from its purpose and circumstance, and disregard the fighting value of the troops involved (which is a given quantity), we are left with the bare concept of the engagement, a shapeless battle in which the only distinguishing factors is the number of troops on either side.
These numbers, therefore, will determine victory. It is, of course, evident from the mass of abstractions I have made to reach this point that superiority of numbers in a given engagement is only one of the factors that determines victory. Superior numbers, far from contributing everything, or even a substantial part, to victory, may actually be contributing very little, depending on the circumstances.
But superiority varies in degree. It can be two to one, or three or four to one, and so on; it can obviously reach the point where it is overwhelming.
In this sense superiority of numbers admittedly is the most important factor in the outcome of an engagement, as long as it is great enough to counterbalance all other contributing circumstance. It thus follows that as many troops as possible should be brought into the engagement at the decisive point.
And, in relation to making a combat model:
Numerical superiority was a material factor. It was chosen from all elements that make up victory because, by using combinations of time and space, it could be fitted into a mathematical system of laws. It was thought that all other factors could be ignored if they were assumed to be equal on both sides and thus cancelled one another out. That might have been acceptable as a temporary device for the study of the characteristics of this single factor; but to make the device permanent, to accept superiority of numbers as the one and only rule, and to reduce the whole secret of the art of war to a formula of numerical superiority at a certain time and a certain place was an oversimplification that would not have stood up for a moment against the realities of life.
Force ratios were discussed in various versions of FM 105-5 Maneuver Control, but as far as I can tell, this was not material analytically developed. It was a set of rules, pulled together by a group of anonymous writers for the sake of being able to adjudicate wargames.
The only detailed quantification of force ratios was provided in Numbers, Predictions and War by Trevor Dupuy. Again, these were modeling constructs, not something that was analytically developed (although there was significant background research done and the model was validated multiple times). He then discusses the subject in his book Understanding War, which I consider the most significant book of the 90+ that he wrote or co-authored.
The only analytically based discussion of force ratios that I am aware of (or at least can think of at this moment) is my discussion in my upcoming book War by Numbers: Understanding Conventional Combat. It is the second chapter of the book: https://dupuyinstitute.org/2016/02/17/war-by-numbers-iii/
In this book, I assembled the force ratios required to win a battle based upon a large number of cases from World War II division-level combat. For example (page 18 of the manuscript):
I did this for the ETO, for the battles of Kharkov and Kursk (Eastern Front 1943, divided by when the Germans are attacking and when the Soviets are attacking) and for PTO (Manila and Okinawa 1945).
There is more than can be done on this, and we do have the data assembled to do this, but as always, I have not gotten around to it. This is why I am already considering a War by Numbers II, as I am already thinking about all the subjects I did not cover in sufficient depth in my first book.
Thanks to a comment made on one of our posts, I recently became aware of a 17 page discussion thread on combat results tables (CRT) that is worth reading. It is here:
By default, much of their discussion of data centers around analysis based upon Trevor Dupuy’s writing, the CBD90 database, the Ardennes Campaign Simulation Data Base (ACSDB), the Kursk Data Base (KDB) and my book War by Numbers. I was not aware of this discussion until yesterday even though the thread was started in 2015 and continues to this year (War by Numbers was published in 2017 so does not appear until the end of page 5 of the thread).
The CBD90 was developed from a Dupuy research effort in the 1980s eventually codified as the Land Warfare Data Base (LWDB). Dupuy’s research was programmed with errors by the government to create the CBD90. A lot of the analysis in my book was based upon a greatly expanded and corrected version of the LWDB. I was the program manager for both the ACSDB and the KDB, and of course, the updated versions of our DuWar suite of combat databases.
There are about a hundred comments I could make to this thread, some in agreement and some in disagreement, but then I would not get my next book finished, so I will refrain. This does not stop me from posting a link:
This seems to be the rule that never goes away. I have a recent a case of it being used in a history book. The book was published in English in 2017 (and in German in 2007). In discussing the preparation for the Battle of Kursk in 1943 the author states that:
A military rule of thumb says an attacker should have a superiority of 3 to 1 in order to have a chance of success. While this vague principal applies only at tactical level, the superiority could be even greater if the defender is entrenched behind fortifications. Given the Kursk salient’s fortress-like defences, that was precisely the case.
This was drawn from Germany and the Second World War, Volume VIII: The Eastern Front 1943-1944: The War in the East and on the Neighboring Fronts, page 86. This section was written by Karl-Heinz Frieser.
This version of the rule now says that you have to have a superiority of 3-to-1 in order to have a chance of success? We have done a little analysis of force ratios compared to outcome. See Chapter 2: Force Ratios (pages 8-13) in War by Numbers. I never heard the caveat in the second sentence that the “principal applies only at tactical level.”
This rule has been discussed by me in previous blog posts. Dr. Frieser made a similar claim in his book The Blitzkrieg Legend:
These books were written by a German author who was an officer in the Bundeswehr, so apparently this rule of thumb has spread to some of our NATO allies, or maybe it started in Germany. We really don’t know where this rule of thumb first came from. It ain’t from Clausewitz.
This text is pulled from page 745 of my Kursk book.
By comparison, the XLVIII Panzer Corps from the 5th through the 11th took 449 tank losses, including broken down Panthers, and may have been responsible for 471 Soviet tanks. Even if one assumes 120 Panthers broke down, and subtracts them from the calculation, this comes out to a 1-to-1.43 exchange ratio. One could, rather, look at the losses from the 6th to the 11th of July for both German corps. This has the advantage of skipping the 5th, when both German corps were penetrating the defensive lines and not facing much armor. Furthermore, it also eliminates a lot of the Panther losses and German losses to mines on the 5th. In this case, from 6 to 11 July, the SS Panzer Corps lost 234 tanks and may have been responsible for 598 Soviet tanks. This is a 1-to-2.56 exchange ratio. The XLVIII Panzer Corps lost 317 tanks while they may have been responsible for 438 Soviet tanks. This is a 1-to-1.38 exchange ratio.
This difference in the exchange ratios between the two German corps probably had a lot more to do with how their opponents choose to fight than the differences in performance between the two German corps. One does wonder if Katukov’s decision to defend with his First Tank Army was the main difference here, as compared to the heavy counterattacking against the SS Panzer Corps that was done under the command of Vatutin and Chistyakov.
In retrospect maybe I should have included this discussion in Chapter 3: Attacker versus Defender of my book War by Numbers: Understanding Conventional Combat. There is a lot of the other Kursk material there in my discussion of human factors in combat.
Changes to Russian tactics typify the manner in which Russia now employs its ground force. Borrowing from the pages of military theorist Carl von Clausewitz, who stated, “It is still more important to remember that almost the only advantage of the attack rests on its initial surprise,” Russia’s contemporary operations embody the characteristic of surprise. Russian operations in Georgia and Ukraine demonstrate a rapid, decentralized attack seeking to temporally dislocate the enemy, triggering the opposing forces’ defeat.
Tactical surprise enabled by electronic, cyber, information and unconventional warfare capabilities, combined with mobile and powerful combined arms brigade tactical groups, and massive and lethal long-range fires provide Russian Army ground forces with formidable combat power.
Trevor Dupuy considered the combat value of surprise to be important enough to cite it as one of his “timeless verities of combat.”
Surprise substantially enhances combat power. Achieving surprise in combat has always been important. It is perhaps more important today than ever. Quantitative analysis of historical combat shows that surprise has increased the combat power of military forces in those engagements in which it was achieved. Surprise has proven to be the greatest of all combat multipliers. It may be the most important of the Principles of War; it is at least as important as Mass and Maneuver.
In his combat models, Dupuy categorized tactical surprise as complete, substantial, and minor; defining the level achieved was a matter of analyst judgement. The combat effects of surprise in battle would last for three days, declining by one-third each day.
He developed two methods for applying the effects of surprise in calculating combat power, each yielding the same general overall influence. In his original Quantified Judgement Model (QJM) detailed inNumbers, Predictions and War: The Use of History to Evaluate and Predict the Outcome of Armed Conflict (1977), factors for surprise were applied to calculations for vulnerability and mobility, which in turn were applied to the calculation of overall combat power. The net value of surprise on combat power ranged from a factor of about 2.24 for complete surprise to 1.10 for minor surprise.
For a simplified version of his combat power calculation detailed in Attrition: Forecasting Battle Casualties and Equipment Losses in Modern War (1990), Dupuy applied a surprise combat multiplier value directly to the calculation of combat power. These figures also ranged between 2.20 for complete surprise and 1.10 for minor surprise.
Dupuy established these values for surprise based on his judgement of the difference between the calculated outcome of combat engagements in his data and theoretical outcomes based on his models. He never validated them back to his data himself. However, TDI President Chris Lawrence recently did conduct substantial tests on TDI’s expanded combat databases in the context of analyzing the combat value of situational awareness. The results are described in detail in his forthcoming book, War By Numbers: Understanding Conventional Combat.
So our work on urban warfare ended in 2005 with the Stalingrad contract being cancelled because of the weather. It was a pretty significant body of work, but the Army’s interest shifted to insurgencies and so did our work. From 2005 through 2009, our major work was on insurgencies, which is summarized in my book America’s Modern Wars.
When things finally got quiet enough for me to consider writing books, I briefly considered doing a book on urban warfare. But, the subject had fallen out of fashion. I therefore decided to try to summarize all our conventional warfare work into a single book, War by Numbers.
Our urban warfare work is described in a half dozen earlier posts. It is covered in much more depth in two chapters of my book War by Numbers. Chapter 16: Urban Legends, cover the three phases of this work (Phase I = ETO, II = Kharkov, III = Manila and post-WWII). The chapter is called “urban legends,” because so much of the work on urban warfare in the time immediately preceding our work overemphasized the intensity, casualties, fatigue and actions that would occur in urban warfare. They had, mistakenly, created a mythology about urban warfare, based upon looking at a few extreme case studies. This discussion on urban warfare flowed into the next chapter, Chapter 17: Use of Case Studies. As I pointed out at the start of that chapter (pages 265-266):
Unfortunately, military history is often the study of exceptions…..What often gets lost is the norm, or what is typical….we at the Dupuy Institute are not averse to using case studies; we simply prefer not to use them as our only analytical tool….We look for the norms and the typical situation and use case studies only as part of a further examination of the study.
The rest of the chapter is based upon the outstanding work that Richard C. Anderson did looking at a number individual division’s operations in a variety of cities (in particular Brest, Aachen, Cherbourg and Manila). More than six different case studies. The most significant one was the work done on urban operations and combat stress, or battle fatigue (it is in our Phase I report, which is on line). This was the work that caused RAND to revise their work and prepare a report that paralleled our research effort.
Chapter 16 is 59 pages long, while Chapter 17 is 20 pages.