There are 576 cases from World War II in our division-level database. There are no engagements from 1939, only two from 1940, seven from 1941, one from 1942 and the rest are from 1943-45.
World War II (576 cases) – complete data set
Force Ratio…………………….Percent Attacker Wins……………….Number of Cases
0.25 to 0.49………………………22%………………………………………………..9
0.50 to 0.98………………………30…………………………………………………50
1.00 to 1.49………………………55……………………………………………….128
1.50 to 1.96………………………61……………………………………………….117
2.01 to 2.49………………………73…………………………………………………48
2.52 to 2.99………………………82…………………………………………………44
3.00 to 3.49………………………76…………………………………………………41
3.50 to 3.98………………………85…………………………………………………26
4.06 to 5.86………………………68…………………………………………………59
6.17 to 7.90………………………87…………………………………………………15
8.20 to 17.87……………………100…………………………………………………20
This clearly makes our point in spades about the U.S. Army three-to-one rule. Above one-to-one odds the attacker wins over half the time and above two-to-one odds the attacker wins over 70% of the time. This is the un-culled data set. The culled data set with 102 cases removed that are “limited action,” limited attack” or “other” consists of only 474 cases. It shows the following:
World War II (474 cases) – culled data set
Force Ratio…………………Percent Attacker Wins…………………Number of Cases
0.25 to 0.49……………………..25%………………………………………………..8
0.50 to 0.98……………………..43………………………………………………….35
1.00 to 1.49……………………..63………………………………………………..111
1.50 to 1.96……………………..68………………………………………………..102
2.01 to 2.49……………………..83………………………………………………….41
2.52 to 2.99……………………..82………………………………………………….39
3.00 to 3.49……………………..79………………………………………………….33
3.50 to 3.98……………………..84………………………………………………….25
4.06 to 5.86……………………..77………………………………………………….48
6.17 to 7.90……………………..87………………………………………………….15
8.20 to 17.87…………………..100………………………………………………….15
22.84-198.69…………………..100…………………………………………………..2
Again, no surprises in this data, and of course, it parallels the patterns seen in the previous data sets.
Now, both World War I and World War II are so massive that with a diligent research effort, thousands of engagements could be assembled. This does take time. Our post-World War II includes almost every significant division-level engagement from the Arab-Israeli fighting of 1956, 1967, 1968 and 1973. The Gulf War category includes every significant division-level engagement from 1991. Let us look at each of them in turn:
World War I and others (30 cases)
Force Ratio……………………Percent Attacker Wins……………..Number of Cases
0.67 to 0.99-to-1………………..29%…………………………………………..7
1.01 to 1.47-to-1………………..11……………………………………………..9
1.58 to 1.80-to-1………………….0……………………………………………..2
2.00 to 2.13-to-1………………..67……………………………………………..3
2.50 to 2.80-to-1………………..67……………………………………………..3
3.00 to 3.20-to-1………………..33……………………………………………..3
4.04 to 4.38-to-1………………..50……………………………………………..2
6.32-to-1………………………..100……………………………………………..1
Note that the attacker is winning to majority of the time at two-to-one odds and higher. The 33% wins in the three-to-one category consists of one victory and two drawn engagements (Bazentin Ridge from the Somme and First Dardanelles Landing from Gallipoli). In both of these cases the attacker advanced, although the engagement is coded as a draw. These three cases do not make a strong argument. This data collection is too small to draw any real conclusions from. The database could certainly be expanded to thousands of cases given time and effort. We also have a collection of engagements from World War I at brigade- and battalion-level and a number of engagements above division-level. These will be explored later.
Our most developed database through is our division-level database of 752 cases covering combat from 1904 to 1991. As this addresses modern combat, it is a useful database for such a test. Of those 752 cases, we have the forces ratios and outcome for 672 of them. All the engagements previously discussed from ETO in 1944 and Kharkov and Kursk in 1943 are drawn from this database. As such, there is some overlap between these 672 cases and the 116 cases from ETO and 73 cases from the Eastern Front previously used. The data shows a very clear pattern related to force ratios.
Division-level Engagements 1904-1991 (672 cases)
Force Ratio…………………..Percent Attacker Wins………………Number of Cases
0.20 to 0.20-to-1………………..0%………………………………………………….2
0.25 to 04.9-to-1………………22…………………………………………………….9
0.50 to 0.99-to-1………………42…………………………………………………..77
1.00 to 1.49-to-1………………55…………………………………………………150
1.50 to 1.99-to-1………………59…………………………………………………123
2.00 to 2.49-to-1………………71…………………………………………………..56
2.50 to 2.99-to-1………………83…………………………………………………..53
3.00 to 3.49-to-1………………69…………………………………………………..48
3.50 to 3.98-to-1………………77…………………………………………………..30
4.06 to 5.87-to-1………………65…………………………………………………..66
6.06 to 7.90-to-1………………88…………………………………………………..17
8.20 to 17.87-to-1……………100…………………………………………………..22
This table drives home in spades the problem with the U.S. Army current interpretation of the three-to-one rule (50% chance of defender success). To start with, the attacker starts winning over half the time at 1.00 to 1.49-to-1 odds. By the time they get to 2.50 to 2.99-to-1 odds they are winning 83% of the time. It is quite clear from this data that the U.S. Army rule is wrong.
Now, this data is skewed a little bit by the inclusion of engagements with “limited action” or only “limited attack.” They include engagements where the attacker has a significant force ratio but conducted only an initial probing attack of battalion size. Sometimes those attacks did not succeed. So the success rate of some the higher odds engagements would actually be higher if these were eliminated. So, we ended up culling 102 of these engagements from the above table to produce the following table. There is not a big difference in the results between this tighter table of 570 cases and the previous table of 672 cases. The primary difference is that the attacker tends to be more successful in all categories. All the culled engagements were from World War II.
Division-level Engagements, 1904-1991 (570 cases) – culled data set
Force Ratio………………….Percent Attacker Wins……………….Number of Cases
0.20 to 0.20-to-1………………..0%…………………………………………………2
0.25 to 04.9-to-1………………25……………………………………………………8
0.50 to 0.99-to-1………………52…………………………………………………..62
1.00 to 1.49-to-1………………62…………………………………………………133
1.50 to 1.99-to-1………………66…………………………………………………108
2.00 to 2.49-to-1………………80………………………………………………….49
2.50 to 2.99-to-1………………83………………………………………………….48
3.00 to 3.49-to-1………………70………………………………………………….40
3.50 to 3.98-to-1………………76………………………………………………….29
4.06 to 5.87-to-1………………73………………………………………………….55
6.06 to 7.90-to-1………………88………………………………………………….17
8.20 to 17.87-to-1……………100………………………………………………….17
56.20-109.98-to-1……………100…………………………………………………..2
Needless to say, this tighter data set is even further biased against the published U.S. Army three-to-one rule.
From 1st Alabama Cavalry, USV website (www.1stalabamacavalryusv.com). Alexander Lawrence was from Fayette County, Alabama and fought for the Union with the 1st Alabama Cavalry
As the three-to-one rule of thumb appears to have evolved out of the American Civil War (although not as published in FM 6-0), then we should probably look at just our Civil War battles in our database.
Among those 243 cases are 49 cases from the American Civil War. As the three-to-one rule may have evolved from that experience, let us looking at just those cases:
Force Ratio……………………Percent Attacker Wins……………….Number of Cases
0.44 to 0.48-to-1…………………0%………………………………………………3
0.53 to 0.97-to-1………………..18……………………………………………….11
1.00 to 1.47-to-1………………..36……………………………………………….14
1.53 to 1.96-to-1………………..25……………………………………………….12
2.10 to 2.31-to-1………………..50…………………………………………………6
3.00-to-1……………………….100…………………………………………………1
5.00-to-1……………………….100…………………………………………………1
15.05-to-1……………………..100…………………………………………………1
The American Civil War is a very good test case for such an examination. Both officer corps were primarily trained at West Point (the U.S. military academy); both armies fought in the same style and doctrine; they used most of the same weapons, including the same muskets and same artillery; they were similar in culture; and they were similar in training, doctrine, background and capability. While some historical mythology has tried to make the southern Americans better fighters, it is hard to accept the argument that a farmer from North Carolina is a different, more motivated or a more capable fighter than a farmer from Pennsylvania. Most of the United States was rural. There wre also units raised to fight for the north from all of the southern states. This is about an equal comparison between two opponents that one is going to find.
The end results from these two tests are that the three-to-one rule as recorded in FM 6-0 clearly does not apply. In the case of the Civil War data at 2.10 to 2.31-to-1 odds the attacker is winning half the time. Where does one get the notion that at 3.00-to-1 odds the defender will win half the time? What historical data established that?
So the U.S. Army version of the three-to-one (meaning defender wins half the time) does not show up in the almost 400 years of history that we are examining here and does not show up in the American Civil War.
Now, at the time I wrote War by Numbers, I was not aware of this sentence planted in FM 6-0 and so therefore did not feel a need to respond to the “3-to-1 rule.” It is a rule of thumb, not completely without value, that had been discussed before. I thought this issue was properly understood in the U.S. analytical and defense community, therefore I did not feel a need to address it further. It turns out that I do. So, let me take a moment to tap into our databases and properly address this using all the resources at my disposal.
First of all, The Dupuy Institute has a database of 243 engagements from 1600-1900 called the Battles Data Base (BaDB). These are almost all field battles, where the two sides deployed their forces of tens of thousands of people and resolve their dispute that day. Of the 243 battles, only 40 of them last longer than a day. The largest engagement has the attacker fielding 365,000 men (Leipzig, 1813) and the smallest engagement had the defender fielding but 350 men (Majuba Hill, 1881).
As this rule of thumb evolved out of the U.S. Civil War, then an examination of historical field battles from 1600-1900 is particularly relevant. Looking at the force ratio for these battles shows:
Force Ratio…………………..Percent Attacker Wins………………..Number of Cases
0.26 to 04.9-to-1………………54%……………………………………………13
0.50 to 0.98-to-1………………54………………………………………………81
1.00 to 1.47-to-1………………56………………………………………………71
1.50 to 1.96-to-1………………63………………………………………………38
2.00 to 2.44-to-1………………50………………………………………………16
2.58 to 2.94-to-1………………57………………………………………………..7
3.00 to 3.43-to-1…………….100………………………………………………..5
3.75 to 3.76-to-1………………..0………………………………………………..2
4.00 to 4.93-to-1………………75………………………………………………..4
7.78 to 16.82-to-1……………..67………………………………………………..6
The pattern here is not particularly clear, as low odds attack, where the attacker is outnumbered, succeed over half the time, as do attacks at higher odds. Some of this is due to the selection of battles, some of this is due to the lack of regular trained armies, and some of this is due to the attacker choosing to attack because they have advantages in morale, training, experience, position, etc. that outweigh the numbers. But, the argument that is made in FM 6-0 that based upon historical data at three-to-one odds the defender wins 50% of the time is clearly not shown. For example, in this data set there are 12 cases between the odds of 2.50 to 3.50-to-1. Of those 12 cases, the attacker wins in 9 of them (75%). The three cases where the defender wins are: 1) Battle of Buena Vista in 1847 where Santa Anna’s Mexican Army attacked Zachary Taylor’s American Army at 2.94-to-1, 2) Battle of Inkeman in 1854 where the Russian Army attacked the French and British armies in Crimea at 2.63-to-1, and 3) Battle of Belfort in 1871 where the French Army attack the German Army at 2.75-to-1. One could certainly argue that in these three cases, the defenders held advantages in training, experience and overall combat effectiveness.
Next post will address the 49 American Civil War battles in our database.
Various Three-to-one rules of thumbs have existed in the U.S. Army and in writings possibly as early as the American Civil War (1861-1865). These are fine as “rules of thumb” as long as one does not take them seriously and understands what they really mean. But, unfortunately, we have now seen something that is a loose rule of thumb turned into a codified and quantified rule. This is annoyingly overstating its importance and as given in U.S. Army manuals, is patently false.
The U.S. Army has apparently codified the “three-to-one rule” in its documentation and has given it a value. In the 2014 edition of FM 6-0, paragraph 9-103, it states that “For example, historically, defenders have over a 50 percent probability of defeating an attacking force approximately three times their equivalent strength.” This statement, on the surface, simply is incorrect. For example, the following table from my book War by Numbers is drawn from a series of 116 division-level engagements in France in 1944 against the Germans (see War by Numbers, page 10) They show the following relationship between force ratio and outcome:
European Theater of Operations (ETO) Data, 1944
Force Ratio………………..Result…………………Percent Failure…Number of cases
0.55 to 1.01-to-1.00………Attack Fails…………………..100%……………….5
1.15 to 1.88-to-1.00………Attack usually succeeds……21%………………..48
1.95 to 2.56-to-1.00………Attack usually succeeds……10%………………..21
2.71-to-1.00 and higher…Attacker Advances…………….0%……………….. 42
Now these engagements are from fighting between the U.S., UK and Germany in France and Germany in 1944. These are engagements between forces of roughly equal competence. As can be seen, based upon 42 division-level engagements, in all cases of attacks at three-to-one (more specifically 2.71-to-1 and greater), the attacker advanced. Meaning in all cases of attacks at three-to-one, the attacker won. This directly contradicts the statement in FM 6-0, and contradicts it based upon historical data.
This is supplemented by the following two tables on the next page of War by Numbers. The first table shows the German performance when attacking Soviet units in 1943.
Germans attacking Soviets (Battles of Kharkov and Kursk), 1943
Force Ratio………………..Result………………….Percent Failure…Number of cases
0.63 to 1.06-to-1.00………Attack usually succeeds……..20%……………………..5
1.18 to 1.87-to-1.00………Attack usually succeeds……….6%……………………17
1.91-to-1.00 and higher…Attacker Advances……………….0%……………………21
The next table shows the Soviet performance when attacking German units in 1943:
Soviets attacking Germans (Battles of Kharkov and Kursk), 1943
Force Ratio………………Result…………………..Percent Failure…Number of cases
0.40 to 1.05-to-1…………Attack usually fails…………70%……………………10
1.20 to 1.65-to-1.00…….Attack often fails…………….50%……………………11
1.91 to 2.89-to-1.00…….Attack sometimes fails…….44%……………………..9
These charts are from the fighting around Kharkov in February, March and August of 1943 and the fighting during the Battle of Kursk in July 1943. It is 73 engagements between the German and Soviet armies.
Now, there is a clear performance difference between the German and the Soviet armies at this time. This is discussed in considerable depth in War by Numbers and will not be addressed here. But, what it amounts to is that the German Army has an advantage in the casualty exchange and that advantage also shows up in the outcomes of the battles, as show above. If they attacked at two-to-one odds are greater, they would win. The Soviets attacking at the same odds would win only 56 percent of the time. Clearly, at the division-level, in a unit to unit comparison, the Germans were two or three times better than their Soviet opponents.
Still, even in the worse case, which is the Soviets attacking the Germans, we do not get to the claim made in FM 6-0, which is the defender won 50% of the time when attacked at three-to-one. In fact, the Soviets managed to win 50% of the time when attacking at 1.20 to 1.65-to-1. Something is clearly wrong with the statement in FM 6-0.
Now, at the time I wrote War by Numbers, I was not aware of this sentence planted in FM 6-0 and so therefore did not feel a need to respond to the “three-to-one rule.” It is a rule of thumb, not completely without value, that had been discussed before (see Dupuy, Understanding War, pages 31-37). I thought this issue was properly understood in the U.S. analytical and defense community, therefore I did not feel a need to address it further. It turns out that I do. So, I will take a moment to tap into our databases and properly address this using all the resources at my disposal. This will be in subsequent blog posts.
Do we need to validate training models? The argument is that as the model is being used for training (vice analysis), it does not require the rigorous validation that an analytical model would require. In practice, I gather this means they are not validated. It is an argument I encountered after 1997. As such, it is not addressed in my letters to TRADOC in 1996: See http://www.dupuyinstitute.org/pdf/v1n4.pdf
Over time, the modeling and simulation industry has shifted from using models for analysis to using models for training. The use of models for training has exploded, and these efforts certainly employ a large number of software coders. The question is, if the core of the analytical models have not been validated, and in some cases, are known to have problems, then what are the models teaching people? To date, I am not aware of any training models that have been validated.
Let us consider the case of JICM. The core of the models attrition calculation was the Situational Force Scoring (SFS). Its attrition calculator for ground combat is based upon a version of the 3-to-1 rule comparing force ratios to exchange ratios. This is discussed in some depth in my book War by Numbers, Chapter 9, Exchange Ratios. To quote from page 76:
If the RAND version of the 3 to 1 rule is correct, then the data should show a 3 to 1 force ratio and a 3 to 1 casualty exchange ratio. However, there is only one data point that comes close to this out of the 243 points we examined.
That was 243 battles from 1600-1900 using our Battles Data Base (BaDB). We also tested it to our Division Level Engagement Data Base (DLEDB) from 1904-1991 with the same result. To quote from page 78 of my book:
In the case of the RAND version of the 3 to 1 rule, there is again only one data point (out of 628) that is anywhere close to the crossover point (even fractional exchange ratio) that RAND postulates. In fact it almost looks like the data conspire to leave a noticeable hole at that point.
So, does this create negative learning? If the ground operations are such that an attacking ends up losing 3 times as many troops as the defender when attacking at 3-to-1 odds, does this mean that the model is training people not to attack below those odds, and in fact, to wait until they have much more favorable odds? The model was/is (I haven’t checked recently) being used at the U.S. Army War College. This is the advanced education institute that most promotable colonels attend before advancing to be a general officer. Is such a model teaching them incorrect relationships, force ratios and combat requirements?
You fight as you train. If we are using models to help train people, then it is certainly valid to ask what those models are doing. Are they properly training our soldiers and future commanders? How do we know they are doing this. Have they been validated?
As I stated in a previous post, I am not aware of any other major validation efforts done in the last 25 years other than what we have done. Still, there is one other effort that needs to be mentioned. This is described in a 2017 report: Using Combat Adjudication to Aid in Training for Campaign Planning.pdf
I gather this was work by J-7 of the Joint Staff to develop Joint Training Tools (JTT) using the Combat Adjudication Service (CAS) model. There are a few lines in the report that warm my heart:
“It [JTT] is based on and expanded from Dupuy’s Quantified Judgement Method of Analysis (QJMA) and Tactical Deterministic Model.”
“The CAS design used Dupuy’s data tables in whole or in part (e.g. terrain, weather, water obstacles, and advance rates).”
“Non-combat power variables describing the combat environment and other situational information are listed in Table 1, and are a subset of variables (Dupuy, 1985).”
“The authors would like to acknowledge COL Trevor N. Dupuy for getting Michael Robel interested in combat modeling in 1979.”
Now, there is a section labeled verification and validation. Let me quote from that:
CAS results have been “Face validated” against the following use cases:
The 3:1 rules. The rule of thumb postulating an attacking force must have at least three times the combat power of the defending force to be successful.
1st (US) Infantry Divison vers 26th (IQ) Infantry Division during Desert Storm
The Battle of 73 Easting: 2nd ACR versus elements of the Iraqi Republican Guards
3rd (US) Infantry Division’s first five days of combat during Operation Iraqi Freedom (OIF)
Each engagement is conducted with several different terrain and weather conditions, varying strength percentages and progresses from a ground only engagement to multi-service engagements to test the effect of CASP [Close Air Support] and interdiction on the ground campaign. Several shortcomings have been detected, but thus far ground and CASP match historical results. However, modeling of air interdiction could not be validated.
So, this is a face validation based upon three cases. This is more than what I have seen anyone else do in the last 25 years.
[This piece was originally posted on 13 July 2016.]
Trevor Dupuy’s article cited in my previous post, “Combat Data and the 3:1 Rule,” was the final salvo in a roaring, multi-year debate between two highly regarded members of the U.S. strategic and security studies academic communities, political scientist John Mearsheimer and military analyst/polymath Joshua Epstein. Carried out primarily in the pages of the academic journal International Security, Epstein and Mearsheimer argued the validity of the 3-1 rule and other analytical models with respect the NATO/Warsaw Pact military balance in Europe in the 1980s. Epstein cited Dupuy’s empirical research in support of his criticism of Mearsheimer’s reliance on the 3-1 rule. In turn, Mearsheimer questioned Dupuy’s data and conclusions to refute Epstein. Dupuy’s article defended his research and pointed out the errors in Mearsheimer’s assertions. With the publication of Dupuy’s rebuttal, the International Security editors called a time out on the debate thread.
These debates played a prominent role in the “renaissance of security studies” because they brought together scholars with different theoretical, methodological, and professional backgrounds to push forward a cohesive line of research that had clear implications for the conduct of contemporary defense policy. Just as importantly, the debate forced scholars to engage broader, fundamental issues. Is “military power” something that can be studied using static measures like force ratios, or does it require a more dynamic analysis? How should analysts evaluate the role of doctrine, or politics, or military strategy in determining the appropriate “balance”? What role should formal modeling play in formulating defense policy? What is the place for empirical analysis, and what are the strengths and limitations of existing data?[1]
It is well worth the time to revisit the contributions to the 1980s debate. I have included a bibliography below that is not exhaustive, but is a place to start. The collapse of the Soviet Union and the end of the Cold War diminished the intensity of the debates, which simmered through the 1990s and then were obscured during the counterterrorism/ counterinsurgency conflicts of the post-9/11 era. It is possible that the challenges posed by China and Russia amidst the ongoing “hybrid” conflict in Syria and Iraq may revive interest in interrogating the bases of military analyses in the U.S and the West. It is a discussion that is long overdue and potentially quite illuminating.
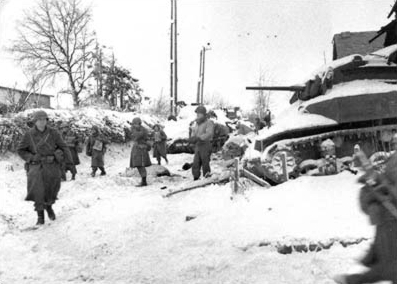
American soldiers of the 117th Infantry Regiment, Tennessee National Guard, part of the 30th Infantry Division, move past a destroyed American M5A1 “Stuart” tank on their march to recapture the town of St. Vith during the Battle of the Bulge, January 1945. [Wikipedia][This piece was originally posted on 16 May 2017.]
This post is a partial response to questions from one of our readers (Stilzkin). On the subject of force ratios in conventional combat….I know of no detailed discussion on the phenomenon published to date. It was clearly addressed by Clausewitz. For example:
At Leuthen Frederick the Great, with about 30,000 men, defeated 80,000 Austrians; at Rossbach he defeated 50,000 allies with 25,000 men. These however are the only examples of victories over an opponent two or even nearly three times as strong. Charles XII at the battle of Narva is not in the same category. The Russian at that time could hardly be considered as Europeans; moreover, we know too little about the main features of that battle. Bonaparte commanded 120,000 men at Dresden against 220,000—not quite half. At Kolin, Frederick the Great’s 30,000 men could not defeat 50,000 Austrians; similarly, victory eluded Bonaparte at the desperate battle of Leipzig, though with his 160,000 men against 280,000, his opponent was far from being twice as strong.
These examples may show that in modern Europe even the most talented general will find it very difficult to defeat an opponent twice his strength. When we observe that the skill of the greatest commanders may be counterbalanced by a two-to-one ratio in the fighting forces, we cannot doubt that superiority in numbers (it does not have to more than double) will suffice to assure victory, however adverse the other circumstances.
and:
If we thus strip the engagement of all the variables arising from its purpose and circumstance, and disregard the fighting value of the troops involved (which is a given quantity), we are left with the bare concept of the engagement, a shapeless battle in which the only distinguishing factors is the number of troops on either side.
These numbers, therefore, will determine victory. It is, of course, evident from the mass of abstractions I have made to reach this point that superiority of numbers in a given engagement is only one of the factors that determines victory. Superior numbers, far from contributing everything, or even a substantial part, to victory, may actually be contributing very little, depending on the circumstances.
But superiority varies in degree. It can be two to one, or three or four to one, and so on; it can obviously reach the point where it is overwhelming.
In this sense superiority of numbers admittedly is the most important factor in the outcome of an engagement, as long as it is great enough to counterbalance all other contributing circumstance. It thus follows that as many troops as possible should be brought into the engagement at the decisive point.
And, in relation to making a combat model:
Numerical superiority was a material factor. It was chosen from all elements that make up victory because, by using combinations of time and space, it could be fitted into a mathematical system of laws. It was thought that all other factors could be ignored if they were assumed to be equal on both sides and thus cancelled one another out. That might have been acceptable as a temporary device for the study of the characteristics of this single factor; but to make the device permanent, to accept superiority of numbers as the one and only rule, and to reduce the whole secret of the art of war to a formula of numerical superiority at a certain time and a certain place was an oversimplification that would not have stood up for a moment against the realities of life.
Force ratios were discussed in various versions of FM 105-5 Maneuver Control, but as far as I can tell, this was not material analytically developed. It was a set of rules, pulled together by a group of anonymous writers for the sake of being able to adjudicate wargames.
The only detailed quantification of force ratios was provided in Numbers, Predictions and War by Trevor Dupuy. Again, these were modeling constructs, not something that was analytically developed (although there was significant background research done and the model was validated multiple times). He then discusses the subject in his book Understanding War, which I consider the most significant book of the 90+ that he wrote or co-authored.
The only analytically based discussion of force ratios that I am aware of (or at least can think of at this moment) is my discussion in my upcoming book War by Numbers: Understanding Conventional Combat. It is the second chapter of the book: https://dupuyinstitute.org/2016/02/17/war-by-numbers-iii/
In this book, I assembled the force ratios required to win a battle based upon a large number of cases from World War II division-level combat. For example (page 18 of the manuscript):
I did this for the ETO, for the battles of Kharkov and Kursk (Eastern Front 1943, divided by when the Germans are attacking and when the Soviets are attacking) and for PTO (Manila and Okinawa 1945).
There is more than can be done on this, and we do have the data assembled to do this, but as always, I have not gotten around to it. This is why I am already considering a War by Numbers II, as I am already thinking about all the subjects I did not cover in sufficient depth in my first book.


 [This piece was originally posted on 13 July 2016.]