Jeffrey H Michaels, a Senior Lecturer in Defence Studies at the British the Joint Services Command and Staff College, has published a detailed look at how Hackett and several senior NATO and diplomatic colleagues constructed the scenario portrayed in the book. Scenario construction is an important aspect of institutional war gaming. A war game will only be as useful if the assumptions that underpin it are valid. As Michaels points out,
Regrettably, far too many scenarios and models, whether developed by military organizations, political scientists, or fiction writers, tend to focus their attention on the battlefield and the clash of armies, navies, air forces, and especially their weapons systems. By contrast, the broader context of the war – the reasons why hostilities erupted, the political and military objectives, the limits placed on military action, and so on – are given much less serious attention, often because they are viewed by the script-writers as a distraction from the main activity that occurs on the battlefield.
Modelers and war gamers always need to keep in mind the fundamental importance of context in designing their simulations.
It is quite easy to project how one weapon system might fare against another, but taken out of a broader strategic context, such a projection is practically meaningless (apart from its marketing value), or worse, misleading. In this sense, even if less entertaining or exciting, the degree of realism of the political aspects of the scenario, particularly policymakers’ rationality and cost-benefit calculus, and the key decisions that are taken about going to war, the objectives being sought, the limits placed on military action, and the willingness to incur the risks of escalation, should receive more critical attention than the purely battlefield dimensions of the future conflict.
These are crucially important points to consider when deciding how to asses the outcomes of hypothetical scenarios.
French retreat from Russia in 1812 by Illarion Mikhailovich Pryanishnikov (1812) [Wikipedia]
After discussing with Chris the series of recent posts on the subject of breakpoints, it seemed appropriate to provide a better definition of exactly what a breakpoint is.
Dorothy Kneeland Clark was the first to define the notion of a breakpoint in her study, Casualties as a Measure of the Loss of Combat Effectiveness of an Infantry Battalion (Operations Research Office, The Johns Hopkins University: Baltimore, 1954). She found it was not quite as clear-cut as it seemed and the working definition she arrived at was based on discussions and the specific combat outcomes she found in her data set [pp 9-12].
DETERMINATION OF BREAKPOINT
The following definitions were developed out of many discussions. A unit is considered to have lost its combat effectiveness when it is unable to carry out its mission. The onset of this inability constitutes a breakpoint. A unit’s mission is the objective assigned in the current operations order or any other instructional directive, written or verbal. The objective may be, for example, to attack in order to take certain positions, or to defend certain positions.
How does one determine when a unit is unable to carry out its mission? The obvious indication is a change in operational directive: the unit is ordered to stop short of its original goal, to hold instead of attack, to withdraw instead of hold. But one or more extraneous elements may cause the issue of such orders:
(1) Some other unit taking part in the operation may have lost its combat effectiveness, and its predicament may force changes, in the tactical plan. For example the inability of one infantry battalion to take a hill may require that the two adjoining battalions be stopped to prevent exposing their flanks by advancing beyond it.
(2) A unit may have been assigned an objective on the basis of a G-2 estimate of enemy weakness which, as the action proceeds, proves to have been over-optimistic. The operations plan may, therefore, be revised before the unit has carried out its orders to the point of losing combat effectiveness.
(3) The commanding officer, for reasons quite apart from the tactical attrition, may change his operations plan. For instance, General Ridgway in May 1951 was obliged to cancel his plans for a major offensive north of the 38th parallel in Korea in obedience to top level orders dictated by political considerations.
(4) Even if the supposed combat effectiveness of the unit is the determining factor in the issuance of a revised operations order, a serious difficulty in evaluating the situation remains. The commanding officer’s decision is necessarily made on the basis of information available to him plus his estimate of his unit’s capacities. Either or both of these bases may be faulty. The order may belatedly recognize a collapse which has in factor occurred hours earlier, or a commanding officer may withdraw a unit which could hold for a much longer time.
It was usually not hard to discover when changes in orders resulted from conditions such as the first three listed above, but it proved extremely difficult to distinguish between revised orders based on a correct appraisal of the unit’s combat effectiveness and those issued in error. It was concluded that the formal order for a change in mission cannot be taken as a definitive indication of the breakpoint of a unit. It seemed necessary to go one step farther and search the records to learn what a given battalion did regardless of provisions in formal orders…
CATEGORIES OF BREAKPOINTS SELECTED
In the engagements studied the following categories of breakpoint were finally selected:
Category of Breakpoint
No. Analyzed
I. Attack [Symbol] rapid reorganization [Symbol] attack
9
II. Attack [Symbol] defense (no longer able to attack without a few days of recuperation and reinforcement
21
III. Defense [Symbol] withdrawal by order to a secondary line
13
IV. Defense [Symbol] collapse
5
Disorganization and panic were taken as unquestionable evidence of loss of combat effectiveness. It appeared, however, that there were distinct degrees of magnitude in these experiences. In addition to the expected breakpoints at attack [Symbol] defense and defense [Symbol] collapse, a further category, I, seemed to be indicated to include situations in which an attacking battalion was ‘pinned down” or forced to withdraw in partial disorder but was able to reorganize in 4 to 24 hours and continue attacking successfully.
Category II includes (a) situations in which an attacking battalion was ordered into the defensive after severe fighting or temporary panic; (b) situations in which a battalion, after attacking successfully, failed to gain ground although still attempting to advance and was finally ordered into defense, the breakpoint being taken as occurring at the end of successful advance. In other words, the evident inability of the unit to fulfill its mission was used as the criterion for the breakpoint whether orders did or did not recognize its inability. Battalions after experiencing such a breakpoint might be able to recuperate in a few days to the point of renewing successful attack or might be able to continue for some time in defense.
The sample of breakpoints coming under category IV, defense [Symbol] collapse, proved to be very small (5) and unduly weighted in that four of the examples came from the same engagement. It was, therefore, discarded as probably not representative of the universe of category IV breakpoints,* and another category (III) was added: situations in which battalions on the defense were ordered withdrawn to a quieter sector. Because only those instances were included in which the withdrawal orders appeared to have been dictated by the condition of the unit itself, it is believed that casualty levels for this category can be regarded as but slightly lower than those associated with defense [Symbol] collapse.
In both categories II and III, “‘defense” represents an active situation in which the enemy is attacking aggressively.
* It had been expected that breakpoints in this category would be associated with very high losses. Such did not prove to be the case. In whatever way the data were approached, most of the casualty averages were only slightly higher than those associated with category II (attack [Symbol] defense), although the spread in data was wider. It is believed that factors other than casualties, such as bad weather, difficult terrain, and heavy enemy artillery fire undoubtedly played major roles in bringing about the collapse in the four units taking part in the same engagement. Furthermore, the casualty figures for the four units themselves is in question because, as the situation deteriorated, many of the men developed severe cases of trench foot and combat exhaustion, but were not evacuated, as they would have been in a less desperate situation, and did not appear in the casualty records until they had made their way to the rear after their units had collapsed.
In 1987-1988, Trevor Dupuy and colleagues at Data Memory Systems, Inc. (DMSi), Janice Fain, Rich Anderson, Gay Hammerman, and Chuck Hawkins sought to create a broader, more generally applicable definition for breakpoints for the study, Forced Changes of Combat Posture (DMSi, Fairfax, VA, 1988) [pp. I-2-3]
The combat posture of a military force is the immediate intention of its commander and troops toward the opposing enemy force, together with the preparations and deployment to carry out that intention. The chief combat postures are attack, defend, delay, and withdraw.
A change in combat posture (or posture change) is a shift from one posture to another, as, for example, from defend to attack or defend to withdraw. A posture change can be either voluntary or forced.
A forced posture change (FPC) is a change in combat posture by a military unit that is brought about, directly or indirectly, by enemy action. Forced posture changes are characteristically and almost always changes to a less aggressive posture. The most usual FPCs are from attack to defend and from defend to withdraw (or retrograde movement). A change from withdraw to combat ineffectiveness is also possible.
Breakpoint is a term sometimes used as synonymous with forced posture change, and sometimes used to mean the collapse of a unit into ineffectiveness or rout. The latter meaning is probably more common in general usage, while forced posture change is the more precise term for the subject of this study. However, for brevity and convenience, and because this study has been known informally since its inception as the “Breakpoints” study, the term breakpoint is sometimes used in this report. When it is used, it is synonymous with forced posture change.
Hopefully this will help clarify the previous discussions of breakpoints on the blog.
People do send me some damn interesting stuff. Someone just sent me a page clipped from U.S. Army FM 3-0 Operations, dated 6 October 2017. There is a discussion in Chapter 7 on “penetration.” This brief discussion on paragraph 7-115 states in part:
7-115. A penetration is a form of maneuver in which an attacking force seeks to rupture enemy defenses on a narrow front to disrupt the defensive system (FM 3-90-1) ….The First U.S. Army’s Operation Cobra (the breakout from the Normandy lodgment in July 1944) is a classic example of a penetration. Figure 7-10 illustrates potential correlation of forces or combat power for a penetration…..”
This is figure 7-10:
So:
Corps shaping operations: 3:1
Corps decisive operations: 9-1
Lead battalion: 18-1
Now, in contrast, let me pull some material from War by Numbers:
From page 10:
European Theater of Operations (ETO) Data, 1944
Force Ratio Result Percent Failure Number of cases
0.55 to 1.01-to-1.00 Attack Fails 100% 5
1.15 to 1.88-to-1.00 Attack usually succeeds 21% 48
1.95 to 2.56-to-1.00 Attack usually succeeds 10% 21
2.71-to-1.00 and higher Attacker Advances 0% 42
Note that these are division-level engagements. I guess I could assemble the same data for corps-level engagements, but I don’t think it would look much different.
From page 210:
Force Ratio…………Cases……Terrain…….Result
1.18 to 1.29 to 1 4 Nonurban Defender penetrated
1.51 to 1.64 3 Nonurban Defender penetrated
2.01 to 2.64 2 Nonurban Defender penetrated
3.03 to 4.28 2 Nonurban Defender penetrated
4.16 to 4.78 2 Urban Defender penetrated
6.98 to 8.20 2 Nonurban Defender penetrated
6.46 to 11.96 to 1 2 Urban Defender penetrated
These are also division-level engagements from the ETO. One will note that out of 17 cases where the defender was penetrated, only once was the force ratio as high as 9 to 1. The mean force ratio for these 17 cases is 3.77 and the median force ratio is 2.64.
Now the other relevant tables in this book are in Chapter 8: Outcome of Battles (page 60-71). There I have a set of tables looking at the loss rates based upon one of six outcomes. Outcome V is defender penetrated. Unfortunately, as the purpose of the project was to determine prisoner of war capture rates, we did not bother to calculate the average force ratio for each outcome. But, knowing the database well, the average force ratio for defender penetrated results may be less than 3-to-1 and is certainly is less than 9-to-1. Maybe I will take few days at some point and put together a force ratio by outcome table.
Now, the source of FM 3.0 data is not known to us and is not referenced in the manual. Why they don’t provide such a reference is a mystery to me, as I can point out several examples of this being an issue. On more than one occasion data has appeared in Army manuals that we can neither confirm or check, and which we could never find the source for. But…it is not referenced. I have not looked at the operation in depth, but don’t doubt that at some point during Cobra they had a 9:1 force ratio and achieved a penetration. But…..this is different than leaving the impression that a 9:1 force ratio is needed to achieve a penetration. I do not know it that was the author’s intent, but it is something that the casual reader might infer. This probably needs to be clarified.
Reilly starts with a very nice statement of the issue:
Clearly breakpoints are crucial when modelling battlefield combat. I have read extensively about it using mostly first hand accounts of battles rather than high level summaries. Some of the major factors causing it appear to be loss of leadership (e.g. Harald’s death at Hastings), loss of belief in the units capacity to achieve its objectives (e.g. the retreat of the Old Guard at Waterloo, surprise often figured in Mongol successes, over confidence resulting in impetuous attacks which fail dramatically (e.g. French attacks at Agincourt and Crecy), loss of control over the troops (again Crecy and Agincourt) are some of the main ones I can think of off hand.
The break-point crisis seems to occur against a background of confusion, disorder, mounting casualties, increasing fatigue and loss of morale. Casualties are part of the background but not usually the actual break point itself.
He then states:
Perhaps a way forward in the short term is to review a number of first hand battle accounts (I am sure you can think of many) and calculate the percentage of times these factors and others appear as breakpoints in the literature.
This has been done. In effect this is what Robert McQuie did in his article and what was the basis for the DMSI breakpoints study.
Why wait for the military to do something? You will die of old age before that happens!
That is distinctly possible. If this really was a simple issue that one person working for a year could produce a nice definitive answer for…..it would have already been done !!!
Let us look at the 1988 Breakpoints study. There was some effort leading up to that point. Trevor Dupuy and DMSI had already looked into the issue. This included developing a database of engagements (the Land Warfare Data Base or LWDB) and using that to examine the nature of breakpoints. The McQuie article was developed from this database, and his article was closely coordinated with Trevor Dupuy. This was part of the effort that led to the U.S. Army’s Concepts Analysis Agency (CAA) to issue out a RFP (Request for Proposal). It was competitive. I wrote the proposal that won the contract award, but the contract was given to Dr. Janice Fain to lead. My proposal was more quantitative in approach than what she actually did. Her effort was more of an intellectual exploration of the issue. I gather this was done with the assumption that there would be a follow-on contract (there never was). Now, up until that point at least a man-year of effort had been expended, and if you count the time to develop the databases used, it was several man-years.
Now the Breakpoints study was headed up by Dr. Janice B. Fain, who worked on it for the better part of a year. Trevor N. Dupuy worked on it part-time. Gay M. Hammerman conducted the interview with the veterans. Richard C. Anderson researched and created an additional 24 engagements that had clear breakpoints in them for the study (that is DMSI report 117B). Charles F. Hawkins was involved in analyzing the engagements from the LWDB. There were several other people also involved to some extent. Also, 39 veterans were interviewed for this effort. Many were brought into the office to talk about their experiences (that was truly entertaining). There were also a half-dozen other staff members and consultants involved in the effort, including Lt. Col. James T. Price (USA, ret), Dr. David Segal (sociologist), Dr. Abraham Wolf (a research psychologist), Dr. Peter Shapiro (social psychology) and Col. John R. Brinkerhoff (USA, ret). There were consultant fees, travel costs and other expenses related to that. So, the entire effort took at least three “man-years” of effort. This was what was needed just get to the point where we are able to take the next step.
This is not something that a single scholar can do. That is why funding is needed.
As to dying of old age before that happens…..that may very well be the case. Right now, I am working on two books, one of them under contract. I sort of need to finish those up before I look at breakpoints again. After that, I will decide whether to work on a follow-on to America’s Modern Wars (called Future American Wars) or work on a follow-on to War by Numbers (called War by Numbers II…being the creative guy that I am). Of course, neither of these books are selling well….so perhaps my time would be better spent writing another Kursk book, or any number of other interesting projects on my plate. Anyhow, if I do War by Numbers II, then I do plan on investing several chapters into addressing breakpoints. This would include using the 1,000+ cases that now populate our combat databases to do some analysis. This is going to take some time. So…….I may get to it next year or the year after that, but I may not. If someone really needs the issue addressed, they really need to contract for it.
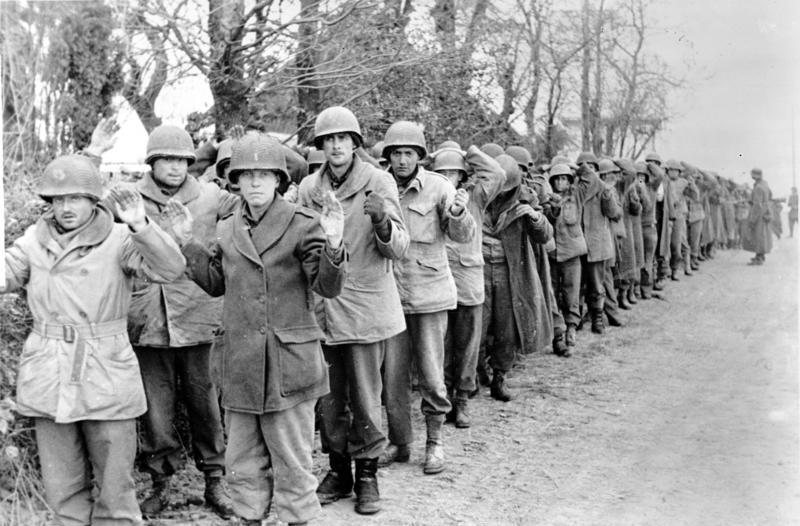
U.S. Army prisoners of war captured by German forces during the Battle of the Bulge in 1944. [Wikipedia]
One of the least studied aspects of combat is battle termination. Why do units in combat stop attacking or defending? Shifts in combat posture (attack, defend, delay, withdrawal) are usually voluntary, directed by a commander, but they can also be involuntary, as a result of direct or indirect enemy action. Why do involuntary changes in combat posture, known as breakpoints, occur?
As Chris pointed out in a previous post, the topic of breakpoints has only been addressed by two known studies since 1954. Most existing military combat models and wargames address breakpoints in at least a cursory way, usually through some calculation based on personnel casualties. Both of the breakpoints studies suggest that involuntary changes in posture are seldom related to casualties alone, however.
Current U.S. Army doctrine addresses changes in combat posture through discussions of culmination points in the attack, and transitions from attack to defense, defense to counterattack, and defense to retrograde. But these all pertain to voluntary changes, not breakpoints.
Army doctrinal literature has little to say about breakpoints, either in the context of friendly forces or potential enemy combatants. The little it does say relates to the effects of fire on enemy forces and is based on personnel and material attrition.
According to ADRP 1-02 Terms and Military Symbols, an enemy combat unit is considered suppressed after suffering 3% personnel casualties or material losses, neutralized by 10% losses, and destroyed upon sustaining 30% losses. The sources and methodology for deriving these figures is unknown, although these specific terms and numbers have been a part of Army doctrine for decades.
The joint U.S. Army and U.S. Marine Corps vision of future land combat foresees battlefields that are highly lethal and demanding on human endurance. How will such a future operational environment affect combat performance? Past experience undoubtedly offers useful insights but there seems to be little interest in seeking out such knowledge.
A breakpoint or involuntary change in posture is an essential part of modeling. There is a breakpoint methodology in C-WAM. According to slide 18 and rule book section 5.7.2 is that ground unit below 50% strength can only defend. It is removed at below 30% strength. I gather this is a breakpoint for a brigade.
Let me just quote from Chapter 18 (Modeling Warfare) of my book War by Numbers: Understanding Conventional Combat (pages 288-289):
The original breakpoints study was done in 1954 by Dorothy Clark of ORO [which can be found here].[1] It examined forty-three battalion-level engagements where the units “broke,” including measuring the percentage of losses at the time of the break. Clark correctly determined that casualties were probably not the primary cause of the breakpoint and also declared the need to look at more data. Obviously, forty-three cases of highly variable social science-type data with a large number of variables influencing them are not enough for any form of definitive study. Furthermore, she divided the breakpoints into three categories, resulting in one category based upon only nine observations. Also, as should have been obvious, this data would apply only to battalion-level combat. Clark concluded “The statement that a unit can be considered no longer combat effective when it has suffered a specific casualty percentage is a gross oversimplification not supported by combat data.” She also stated “Because of wide variations in data, average loss percentages alone have limited meaning.”[2]
Yet, even with her clear rejection of a percent loss formulation for breakpoints, the 20 to 40 percent casualty breakpoint figures remained in use by the training and combat modeling community. Charts in the 1964 Maneuver Control field manual showed a curve with the probability of unit break based on percentage of combat casualties.[3] Once a defending unit reached around 40 percent casualties, the chance of breaking approached 100 percent. Once an attacking unit reached around 20 percent casualties, the chance of it halting (type I break) approached 100% and the chance of it breaking (type II break) reached 40 percent. These data were for battalion-level combat. Because they were also applied to combat models, many models established a breakpoint of around 30 or 40 percent casualties for units of any size (and often applied to division-sized units).
To date, we have absolutely no idea where these rule-of-thumb formulations came from and despair of ever discovering their source. These formulations persist despite the fact that in fifteen (35%) of the cases in Clark’s study, the battalions had suffered more than 40 percent casualties before they broke. Furthermore, at the division-level in World War II, only two U.S. Army divisions (and there were ninety-one committed to combat) ever suffered more than 30% casualties in a week![4] Yet, there were many forced changes in combat posture by these divisions well below that casualty threshold.
The next breakpoints study occurred in 1988.[5] There was absolutely nothing of any significance (meaning providing any form of quantitative measurement) in the intervening thirty-five years, yet there were dozens of models in use that offered a breakpoint methodology. The 1988 study was inconclusive, and since then nothing further has been done.[6]
This seemingly extreme case is a fairly typical example. A specific combat phenomenon was studied only twice in the last fifty years, both times with inconclusive results, yet this phenomenon is incorporated in most combat models. Sadly, similar examples can be pulled for virtually each and every phenomena of combat being modeled. This failure to adequately examine basic combat phenomena is a problem independent of actual combat modeling methodology.
[3] Headquarters, Department of the Army, FM 105-5 Maneuver Control (Washington, D.C., December, 1967), pages 128-133.
[4] The two exceptions included the U.S. 106th Infantry Division in December 1944, which incidentally continued fighting in the days after suffering more than 40 percent losses, and the Philippine Division upon its surrender in Bataan on 9 April 1942 suffered 100% losses in one day in addition to very heavy losses in the days leading up to its surrender.
[5] This was HERO Report number 117, Forced Changes of Combat Posture (Breakpoints) (Historical Evaluation and Research Organization, Fairfax, VA., 1988). The intervening years between 1954 and 1988 were not entirely quiet. See HERO Report number 112, Defeat Criteria Seminar, Seminar Papers on the Evaluation of the Criteria for Defeat in Battle (Historical Evaluation and Research Organization, Fairfax, VA., 12 June 1987) and the significant article by Robert McQuie, “Battle Outcomes: Casualty Rates as a Measure of Defeat” in Army, issue 37 (November 1987). Some of the results of the 1988 study was summarized in the book by Trevor N. Dupuy, Understanding Defeat: How to Recover from Loss in Battle to Gain Victory in War (Paragon House Publishers, New York, 1990).
[6] The 1988 study was the basis for Trevor Dupuy’s book: Col. T. N. Dupuy, Understanding Defeat: How to Recover From Loss in Battle to Gain Victory in War (Paragon House Publishers, New York, 1990).
In an exchange with one of readers, he mentioned that about the possibility to quantifiably access the performances of armies and produce a ranking from best to worst. The exchange is here:
We have done some work on this, and are the people who have done the most extensive published work on this. Swedish researcher Niklas Zetterling in his book Normandy 1944: German Military Organization, Combat Power and Organizational Effectiveness also addresses this subject, as he has elsewhere, for example, an article in The International TNDM Newsletter, volume I, No. 6, pages 21-23 called “CEV Calculations in Italy, 1943.” It is here: http://www.dupuyinstitute.org/tdipub4.htm
When it came to measuring the differences in performance of armies, Martin van Creveld referenced Trevor Dupuy in his book Fighting Power: German and U.S. Army Performance, 1939-1945, pages 4-8.
What Trevor Dupuy has done is compare the performances of both overall forces and individual divisions based upon his Quantified Judgment Model (QJM). This was done in his book Numbers, Predictions and War: The Use of History to Evaluate and Predict the Outcome of Armed Conflict. I bring the readers attention to pages ix, 62-63, Chapter 7: Behavioral Variables in World War II (pages 95-110), Chapter 9: Reliably Representing the Arab-Israeli Wars (pages 118-139), and in particular page 135, and pages 163-165. It was also discussed in Understanding War: History and Theory of Combat, Chapter Ten: Relative Combat Effectiveness (pages 105-123).
I ended up dedicating four chapters in my book War by Numbers: Understanding Conventional Combat to the same issue. One of the problems with Trevor Dupuy’s approach is that you had to accept his combat model as a valid measurement of unit performance. This was a reach for many people, especially those who did not like his conclusions to start with. I choose to simply use the combined statistical comparisons of dozens of division-level engagements, which I think makes the case fairly convincingly without adding a construct to manipulate the data. If someone has a disagreement with my statistical compilations and the results and conclusions from it, I have yet to hear them. I would recommend looking at Chapter 4: Human Factors (pages 16-18), Chapter 5: Measuring Human Factors in Combat: Italy 1943-1944 (pages 19-31), Chapter 6: Measuring Human Factors in Combat: Ardennes and Kursk (pages 32-48), and Chapter 7: Measuring Human Factors in Combat: Modern Wars (pages 49-59).
Now, I did end up discussing Trevor Dupuy’s model in Chapter 19: Validation of the TNDM and showing the results of the historical validations we have done of his model, but the model was not otherwise used in any of the analysis done in the book.
But….what we (Dupuy and I) have done is a comparison between forces that opposed each other. It is a measurement of combat value relative to each other. It is not an absolute measurement that can be compared to other armies in different times and places. Trevor Dupuy toyed with this on page 165 of NPW, but this could only be done by assuming that combat effectiveness of the U.S. Army in WWII was the same as the Israeli Army in 1973.
Anyhow, it is probably impossible to come up with a valid performance measurement that would allow you to rank an army from best to worse. It is possible to come up with a comparative performance measurement of armies that have faced each other. This, I believe we have done, using different methodologies and different historical databases. I do believe it would be possible to then determine what the different factors are that make up this difference. I do believe it would be possible to assign values or weights to those factors. I believe this would be very useful to know, in light of the potential training and organizational value of this knowledge.
Instead of responding in the comments section, I have decided to respond with another blog post.
As the person points out, most Army simulations exist to “enable students/staff to maintain and improve readiness…improve their staff skills, SOPs, reporting procedures, and planning….”
Yes this true, but I argue that this does not obviate the need for accurate simulations. Assuming no change in complexity, I cannot think of a single scenario where having a less accurate model is more desirable that having a more accurate model.
Now what is missing from many of these models that I have seen? Often a realistic unit breakpoint methodology, a proper comparison of force ratios, a proper set of casualty rates, addressing human factors, and many other matters. Many of these things are being done in these simulations already, but are being done incorrectly. Quite simply, they do not realistically portray a range of historical or real combat examples.
He then quotes the 1997-1998 Simulation Handbook of the National Simulations Training Center:
The algorithms used in training simulations provide sufficient fidelity for training, not validation of war plans. This is due to the fact that important factors (leadership, morale, terrain, weather, level of training or units) and a myriad of human and environmental impacts are not modeled in sufficient detail….”
Let’s take their list made around 20 years ago. In the last 20 years, what significant quantitative studies have been done on the impact of leadership on combat? Can anyone list them? Can anyone point to even one? The same with morale or level of training of units. The Army has TRADOC, the Army Staff, Leavenworth, the War College, CAA and other agencies, and I have not seen in the last twenty years a quantitative study done to address these issues. And what of terrain and weather? They have been around for a long time.
Army simulations have been around since the late 1950s. So at the time these shortfalls are noted in 1997-1998, 40 years had passed. By their own admission, these issues had not been adequately addressed in the previous 40 years. I gather they have not been adequately in addressed in the last 20 years. So, the clock is ticking, 60 years of Army modeling and simulation, and no one has yet fully and properly address many of these issues. In many cases, they have not even gotten a good start in addressing them.
Anyhow, I have little interest in arguing these issues. My interest is in correcting them.
Dr. Peter Perla, noted defense researcher, wargame designer and expert, and author of the seminal The Art of Wargaming: A Guide for Professionals and Hobbyists, gave the keynote address at the 2017 Connections Wargaming Conference last August. The topic of his speech, which served as his valedictory address on the occasion of his retirement from government service, addressed the predictive power of wargaming. In it, Perla recalled a conversation he once had with Trevor Dupuy in the early 1990s:
Like most good stories, this one has a beginning, a middle, and an end. I have sort of jumped in at the middle. So let’s go back to the beginning.
As it happens, that beginning came during one of the very first Connections. It may even have been the first one. This thread is one of those vivid memories we all have of certain events in life. In my case, it is a short conversation I had with Trevor Dupuy.
I remember the setting well. We were in front of the entrance to the O Club at Maxwell. It was kind of dark, but I can’t recall if it was in the morning before the club opened for our next session, or the evening, before a dinner. Trevor and I were chatting and he said something about wargaming being predictive. I still recall what I said.
“Good grief, Trevor, we can’t even predict the outcome of a Super Bowl game much less that of a battle!” He seemed taken by surprise that I felt that way, and he replied, “Well, if that is true, what are we doing? What’s the point?”
I had my usual stock answers. We wargame to develop insights, to identify issues, and to raise questions. We certainly don’t wargame to predict what will happen in a battle or a war. I was pretty dogmatic in those days. Thank goodness I’m not that way any more!
The question of prediction did not go away, however.
For the rest of Perla’s speech, see here. For a wonderful summary of the entire 2017 Connections Wargaming conference, see here.
Christopher A. Lawrence, War by Numbers: Understanding Conventional Combat (Lincoln, NE: Potomac Books, 2017) 390 pages, $39.95
War by Numbers assesses the nature of conventional warfare through the analysis of historical combat. Christopher A. Lawrence (President and Executive Director of The Dupuy Institute) establishes what we know about conventional combat and why we know it. By demonstrating the impact a variety of factors have on combat he moves such analysis beyond the work of Carl von Clausewitz and into modern data and interpretation.
Using vast data sets, Lawrence examines force ratios, the human factor in case studies from World War II and beyond, the combat value of superior situational awareness, and the effects of dispersion, among other elements. Lawrence challenges existing interpretations of conventional warfare and shows how such combat should be conducted in the future, simultaneously broadening our understanding of what it means to fight wars by the numbers.
The book is available in paperback directly from Potomac Books and in paperback and Kindle from Amazon.